How can I use the Monthly Indicator data?
You can use the information from these reports for updates to clients.
This report breaks down the metrics into additional helpful detail, where you can take one slide at a time and understand what the market is telling you. In most cases, you can pick the charts that apply to the situation at hand to help identify trends.
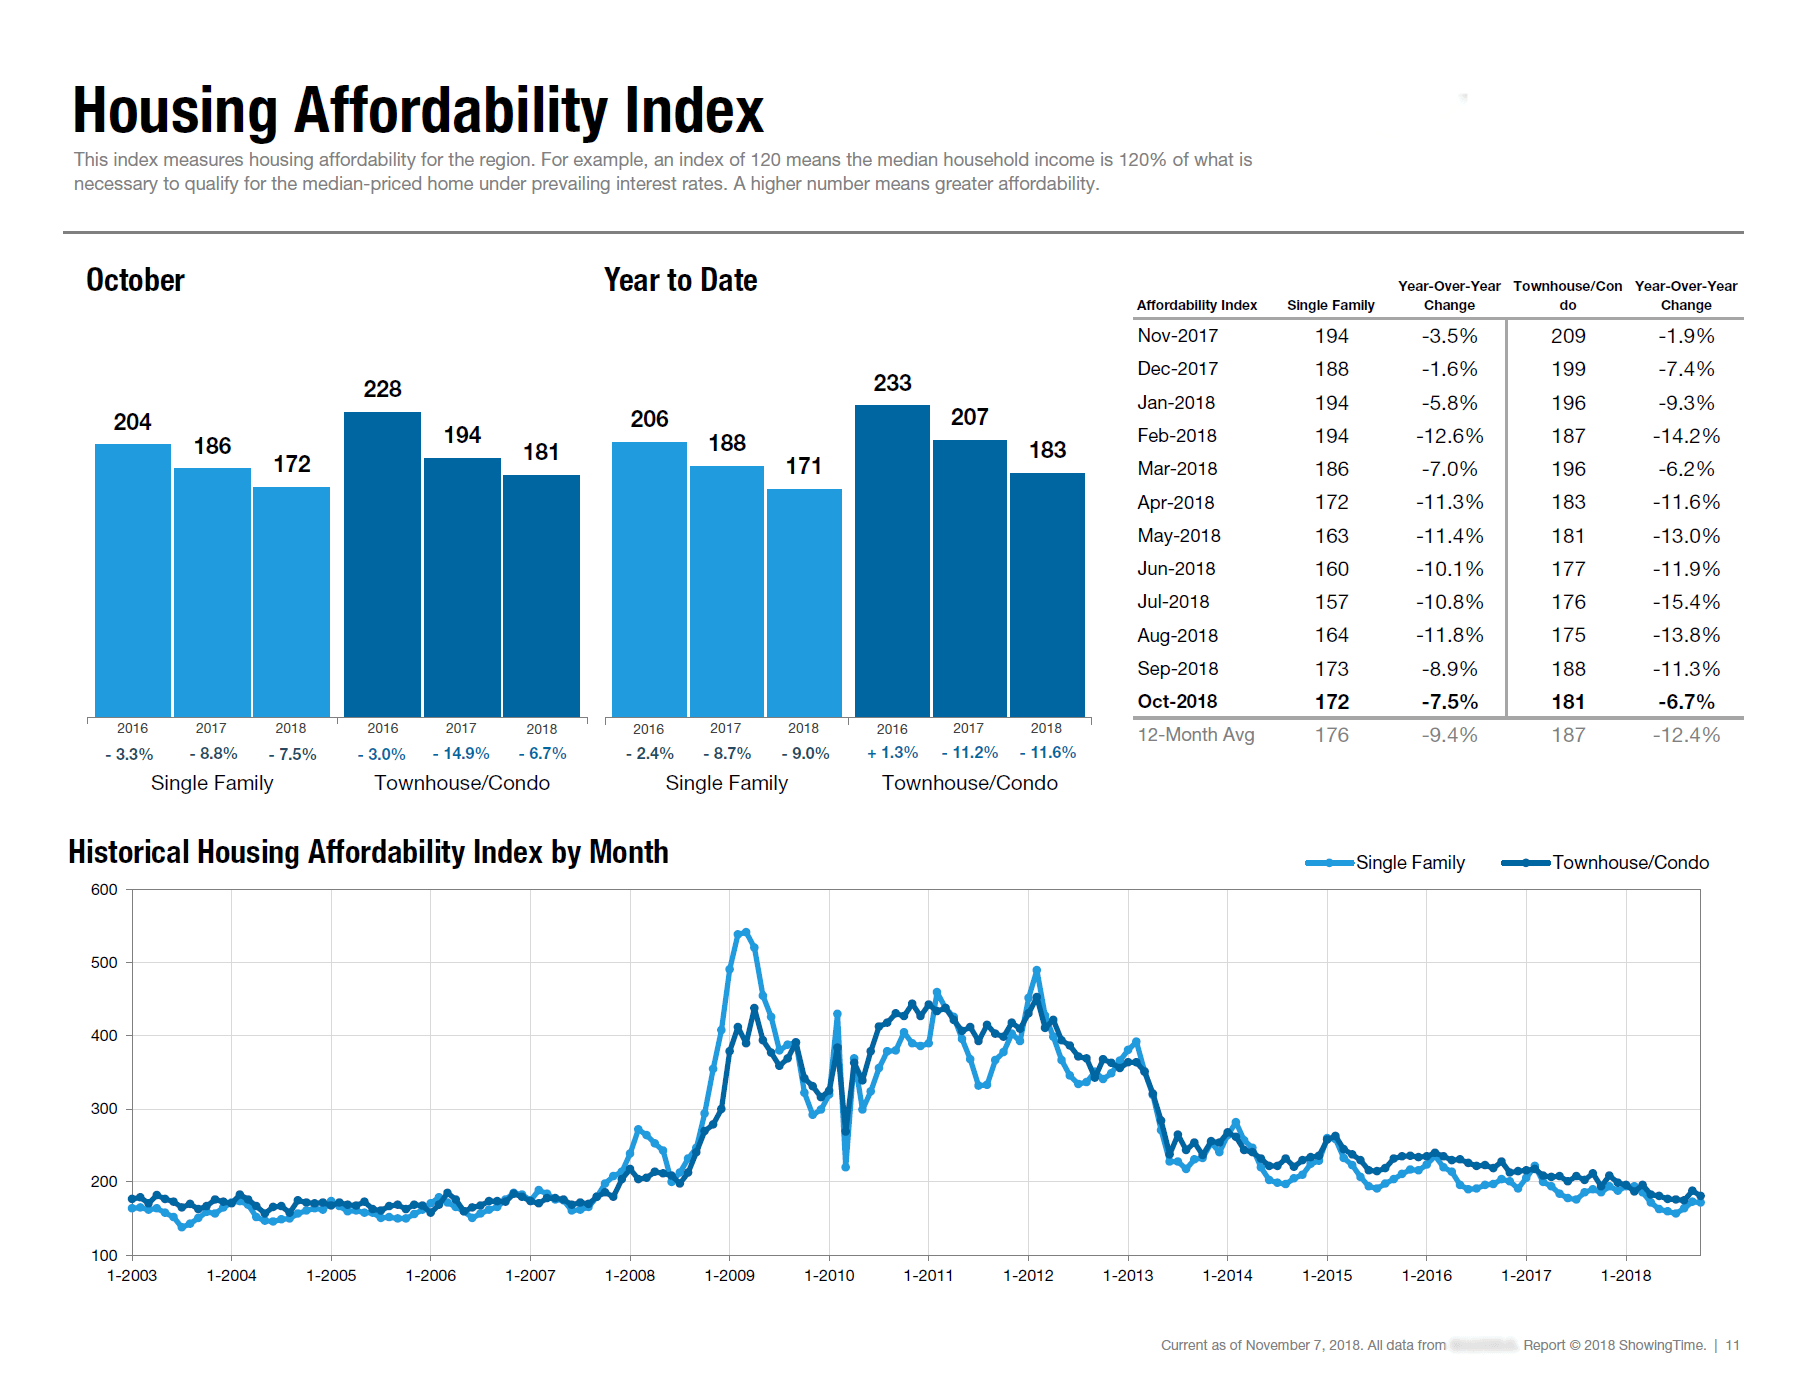
For example, the Housing Affordability index takes into account the median income for your region, the median sales price, and the prevailing mortgage rates to give you an idea of how affordable the market is. The higher the value = the more affordable the market. The trend is more important than the value in most cases.

Click the image for the full size.
This report breaks down the metrics into additional helpful detail, where you can take one slide at a time and understand what the market is telling you. In most cases, you can pick the charts that apply to the situation at hand to help identify trends.
For example, the Housing Affordability index takes into account the median income for your region, the median sales price, and the prevailing mortgage rates to give you an idea of how affordable the market is. The higher the value = the more affordable the market. The trend is more important than the value in most cases.

Click the image for the full size.


