InfoSparks Use Cases
Some ways you can share the data include:
You can compare and contrast different areas in InfoSparks to see how different communities are comparing to each other or the region.

Click the image for the full size.
Select Add an Area
Select the new area
Select additional criteria to filter by
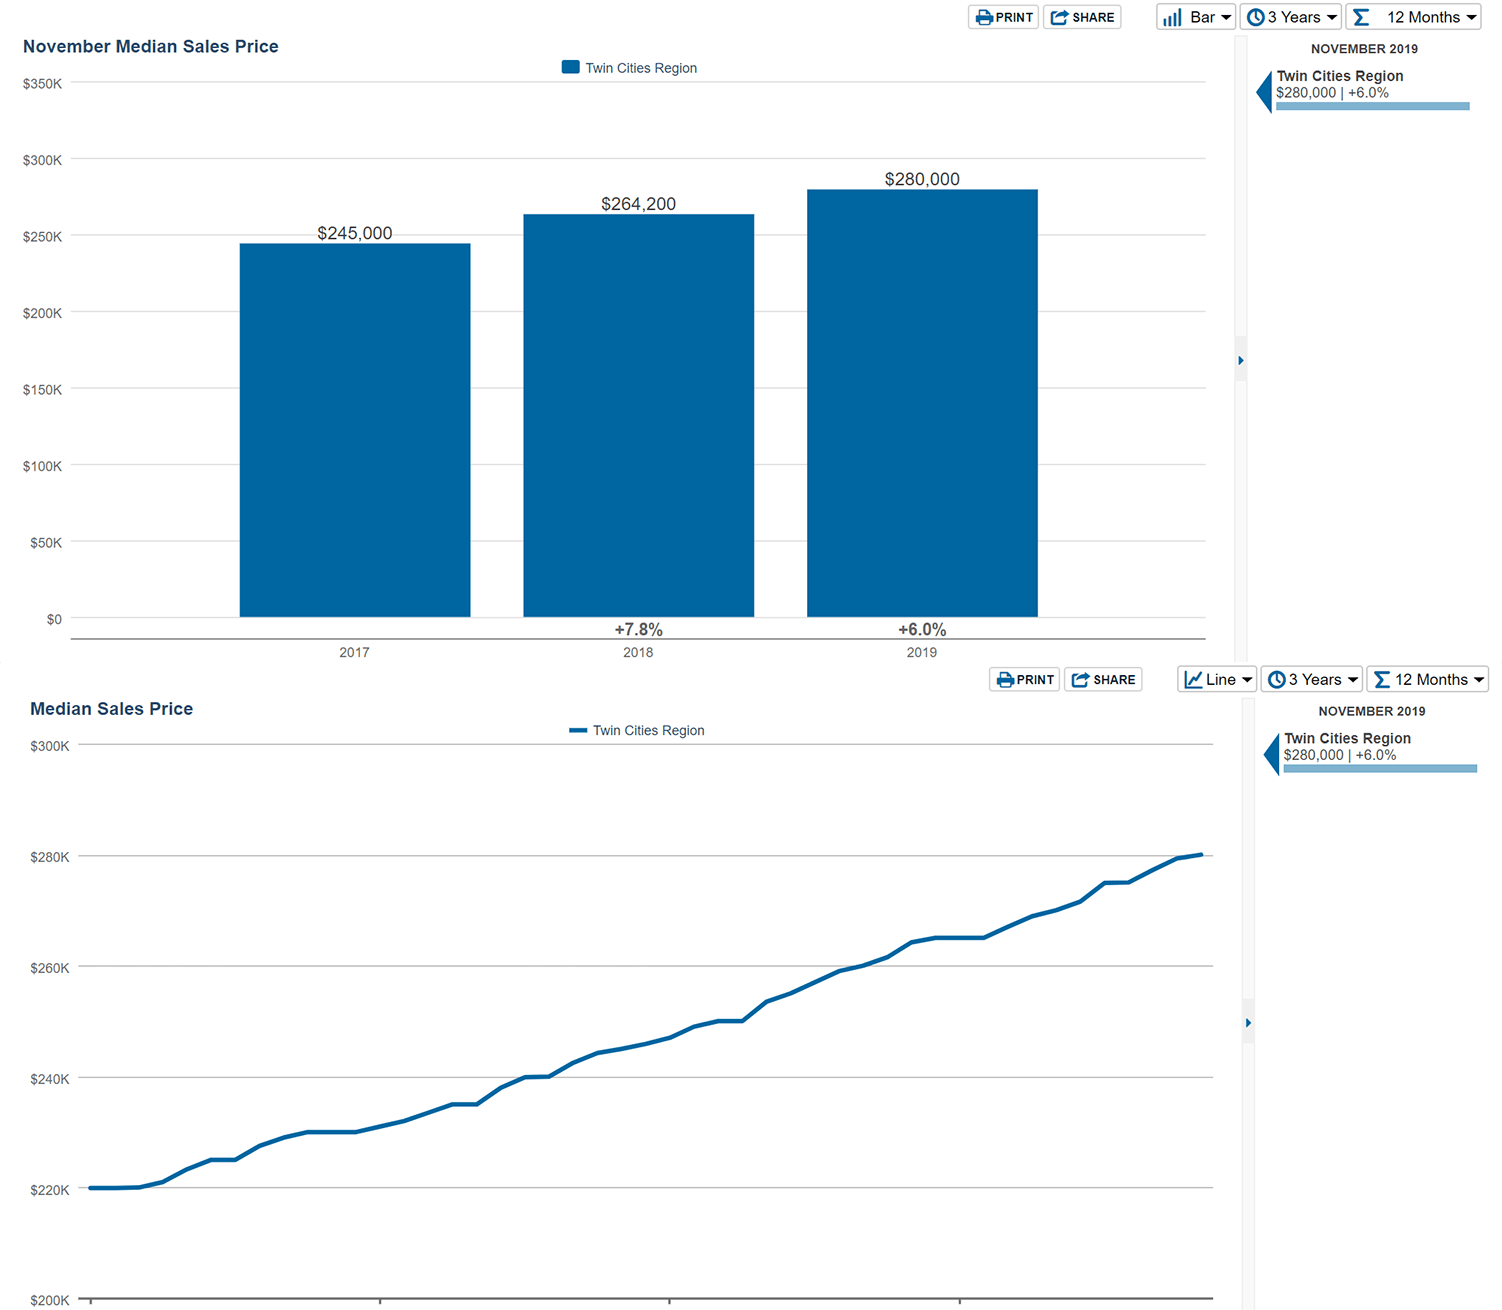
You can change the time frame to narrow down results. You may want to examine seasonality by switching from a rolling 12-month view to a monthly view. You can also switch from Bar charts to Line Charts.

Click the image for the full size.
This is both a different way to see the same data but also provides a different sense of the market.
You can print reports from Infosparks with branding and even your agent photo. Printed reports will also show the filters and time periods. This is a great way to narrow down the information to help your sellers.
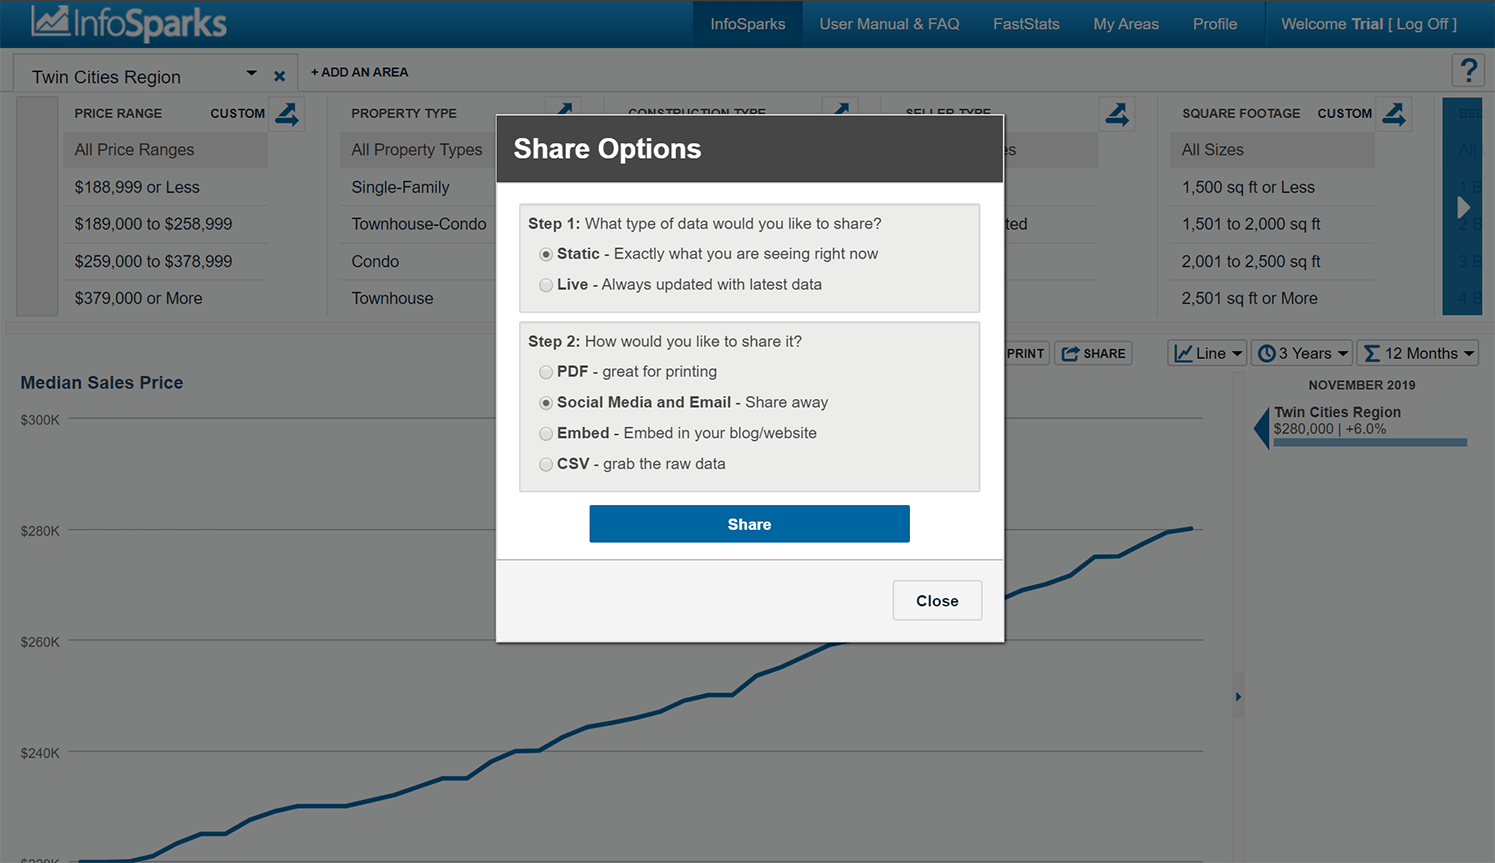
You can share the data in different formats.

Click the image for the full size.
Static: A snapshot of things as they are at the moment.
Live: A dynamic chart that updates automatically. (You cannot have a live PDF) Live charts provide interactivity and options to share to other locations.
*InfoSparks is updated every night through the end of the previous month.
- Shared Chart on your website
- Property Specific reports
- Segment specific (New construction vs existing)
- Community spotlight
- Monthly Stats update (Blog about it: talk about sales in your market)
- Rebrand or expand the stats for your market.
You can compare and contrast different areas in InfoSparks to see how different communities are comparing to each other or the region.

Click the image for the full size.
Step 1
Select Add an Area
Step 2
Select the new area
Step 3
Select additional criteria to filter by
You can change the time frame to narrow down results. You may want to examine seasonality by switching from a rolling 12-month view to a monthly view. You can also switch from Bar charts to Line Charts.

Click the image for the full size.
This is both a different way to see the same data but also provides a different sense of the market.
You can print reports from Infosparks with branding and even your agent photo. Printed reports will also show the filters and time periods. This is a great way to narrow down the information to help your sellers.
You can share the data in different formats.

Click the image for the full size.
Static: A snapshot of things as they are at the moment.
Live: A dynamic chart that updates automatically. (You cannot have a live PDF) Live charts provide interactivity and options to share to other locations.
*InfoSparks is updated every night through the end of the previous month.


